Active Region : 11158
Extreme Solar Activity
"Begining of the new Cycle"
Observing the Sun is always a good chance of watching a major eruptive event. People are used to say that the Sun permits us to see its glory only in the begining or the ending of the Solar Cycle and not during the Maximum or the Minimum. From one point of view this is true, cause the history has shown us the the stronger and most powerful events occure during those periods of time.
February 2011 did remind us that there is always something to observe in the Sun. During the 10th of February 2011 a new active region cracked through the Solar surface, first some strong magnetic fields and after a few hours some spots emerged on Photosphere. The whole system grown up realy quick and gave us many intresting views through many different solar filters.
A.) Photospheric Data Analisys.

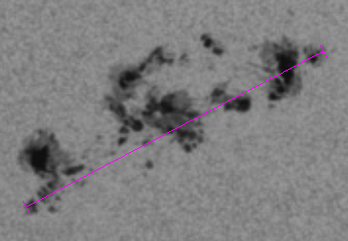
Sunspot Images taken with a 150mm f/1200mm Refractor Telescope and a Full Framme Canon EOS 5D Mrk II DSLR with a 2x teleconverter by 'Elizabeth Observatory'
As you can see from the above images, AR: 1158 developed in really fast rates. One of the intresting things about the AR:1158 is that it seems to have 3 major activity centers that stay constant on 13 and 14th of February images with no big diferences, this means that the AR must be categorized as an "E" or "C" class group. As the "Zurich Classification system of sunspot groups" determines, the only diference between the "E" and "C" class groups is the angular size of it.
In order to determine the Classification of the AR we measured the Pressiding and Following spots of the AR distance from the Centeral Meridian the Sun. Those measurements are presented in the Graph:01.
In order to determine the Classification of the AR we measured the Pressiding and Following spots of the AR distance from the Centeral Meridian the Sun. Those measurements are presented in the Graph:01.
Sunspot measurements inside the AR 1158 images.
From the above diagramm we measure the angular size of the Active Region to be up to 7.18 degrees at 11th of February, and 8.82 degrees on 14th of February 2011. Those measurements in combination with the formation of the ARegion lead us to the "D" class classification.
One thing also intresting on this area is the big differences between the numbers of "Pores" and "Spots" present on the group. So the next step was to measure the Spots and Pores that are vissible on the High Ressolution white light images (seen above) and put the numbers in the next Graph: 02.
One thing also intresting on this area is the big differences between the numbers of "Pores" and "Spots" present on the group. So the next step was to measure the Spots and Pores that are vissible on the High Ressolution white light images (seen above) and put the numbers in the next Graph: 02.
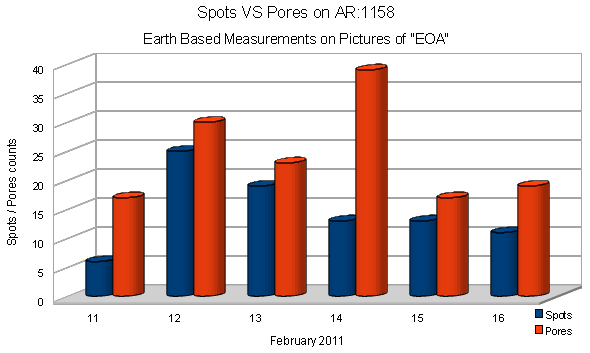
What is really intresting and worth mentioning on the Graph 02, is that the "Pores" (small spots with no penumbra or many small spots inside or near penumbra) are always more than the Sunspots, and in the casse of 14th of February the "Pores" are more than twise as many from the Spots.
Next thing to be measured in our list was the distance between the "P" and "F" Sunspots in "km". The measurements were made both in Photospheric images and Chromospheric images of the "E.O.A.". The results can be seen in the last diagram (Graph:03).
Next thing to be measured in our list was the distance between the "P" and "F" Sunspots in "km". The measurements were made both in Photospheric images and Chromospheric images of the "E.O.A.". The results can be seen in the last diagram (Graph:03).
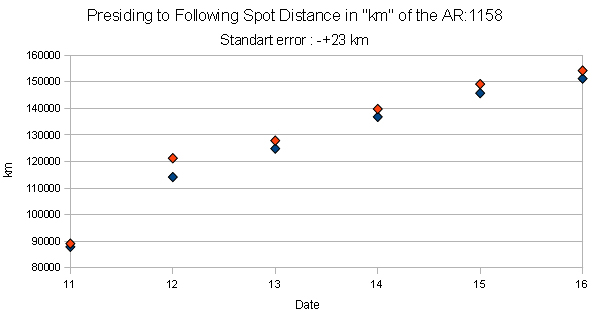
Red dots : Chromospheric distance / Blue dots : Photospheric distance
All above measurements are made in full disk images of White Light and Ha' taken by the E.O.A.
Measurements made with "Win-Jupos" freeware.
Measurements made with "Win-Jupos" freeware.
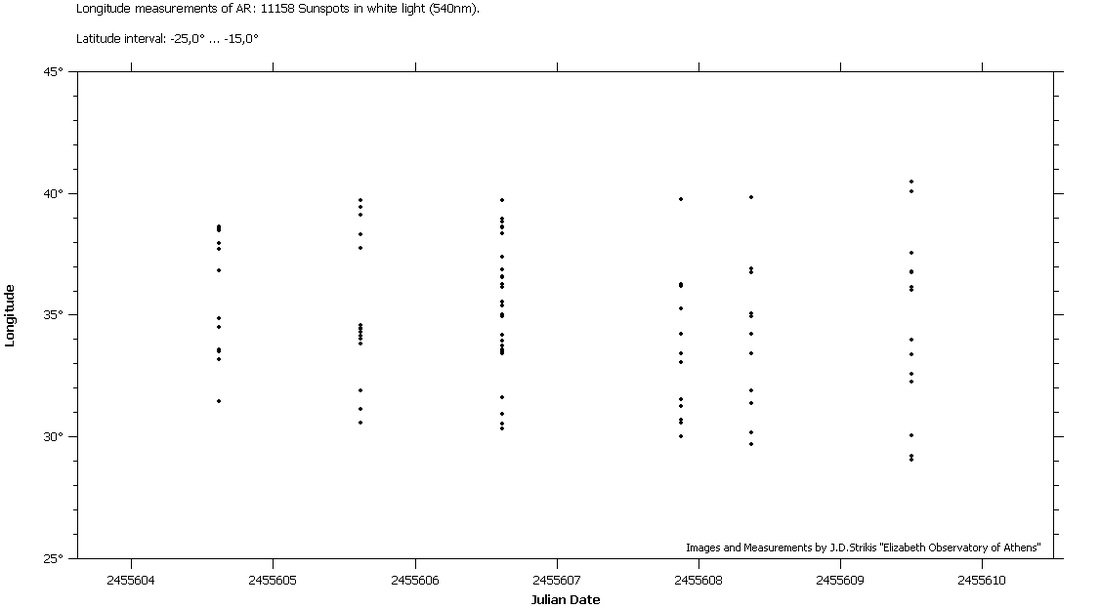
The last thing to be studied in the Photospheric Data is the Latitude/Longitude distribution of the Sunspots inside the AR1158. In order to do that we measured the latitude and longitude of all the Sunspots inside the AR1158 using also the Jupos software and then we ploted the data as seen below.
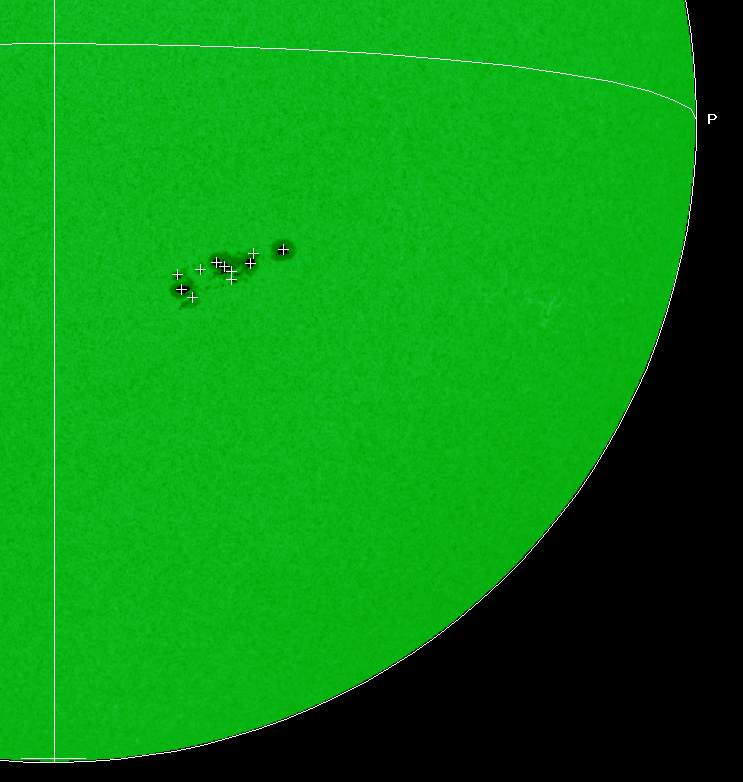

From the above data we see the interesting part of the Sunspots that show us how they are distributed through the Solar Surface.
B.) Chromospheric Data Analysis.
As we sayed to the beggining of this article, this is the best period to watch some of the greatest erruptive phenomena of the solar cycle. From the White Light images of the 11th to 13th of February we see that the AR:1158 was a verry fast growing group of Sunspots. This has caused a great factor of unstability on the magnetic fields of the area, this can be seen on the next composition of images.
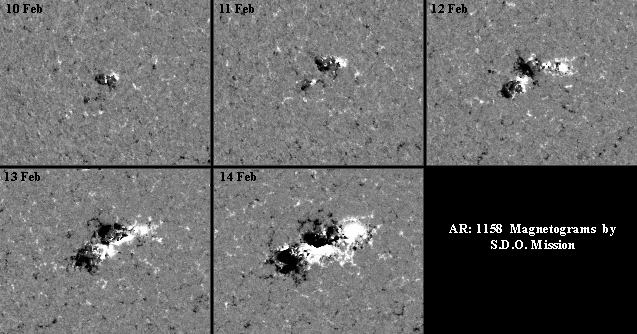
The above images from the HMI Magnetogram of S.D.O. mission show us how rapidly changes occured the first days of the appearence of the AR:1158 and also the complexity of the magnetic fields. In the early hours of the 13th of February morning, many organizations published anouncements that called the Solar Observers around the world to be alerted about "C"-Class Flares, a few hours later many flares occured in this AR and one of them was the biggest Flare (M6.6 Flare) seen the last years.
As seen on the GOES X-Ray Solar Activity monitor (left image), more than five powerfull C-5 to C-9 Flares occured from the February 13th to February 15th. Among them the best flare seen the last years, a X2.0 flare directed directly to Earth occured on February 13th.
As seen on the GOES X-Ray Solar Activity monitor (left image), more than five powerfull C-5 to C-9 Flares occured from the February 13th to February 15th. Among them the best flare seen the last years, a X2.0 flare directed directly to Earth occured on February 13th.
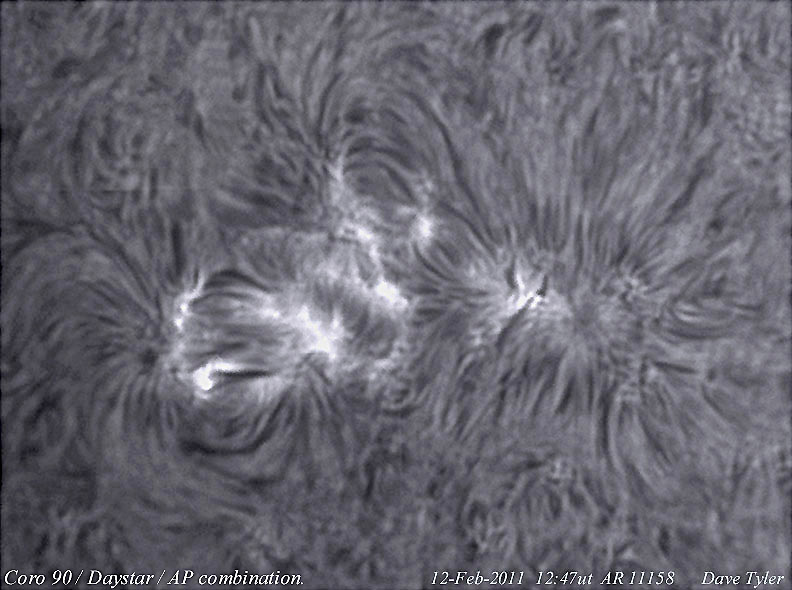
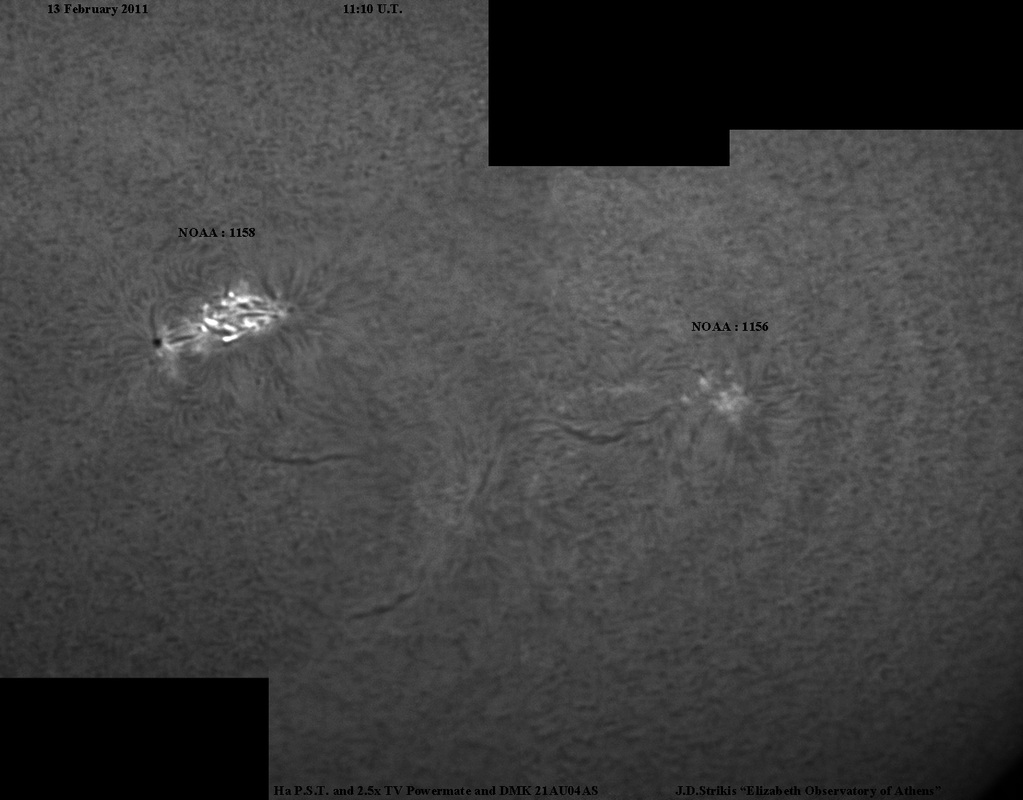
Dave Tyler images and Our images in Ηα΄ (656,3nm) confirm that complexity of the magnetic fields on the AR mentioned above.
Doppler imaging of the AR:1158
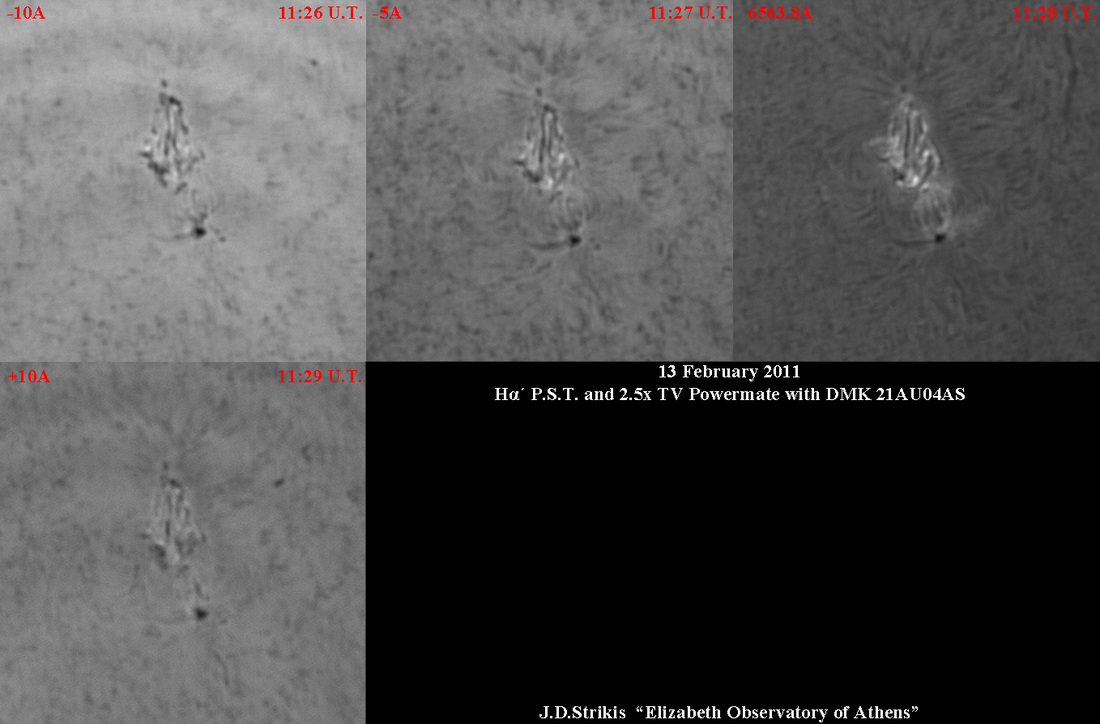
Lastly we did perform some decent Doppler imaging sessions. Those images on the left clearly show us parts of the chromosphere showing huge velocity rates from -80km/sec up to 130km/sec.
We believe that the future hides many exciting moments for Solar Observers around the world.
So be prepared and pay a litle attencion on our site.
So be prepared and pay a litle attencion on our site.
CLEAR SKY
AND
GOOD OBSERVING
All the above images are made from the Elizabeth Observatory of Athens by J.D.Strikis. Otherwise mentioned.
