22 January 2011
Eruptive Prominences
Flaring Active Regions
and much more
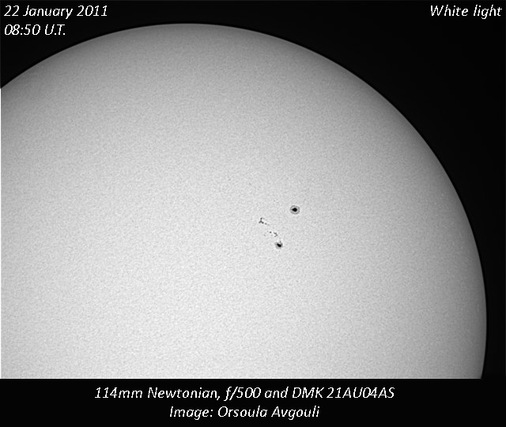
From 15th of January 2011 the Sun seems to have waken in many ways. Active regions 1147 and 1149 are verry active producing a lot of small flares. Also at the Solar limb, many huge prominences are vissible, some of them were stady and some of them were eruptive.
In this article we are going to present you observations done during the 22 of January 2011 concerning some major events.
In this article we are going to present you observations done during the 22 of January 2011 concerning some major events.
A) Photosphere
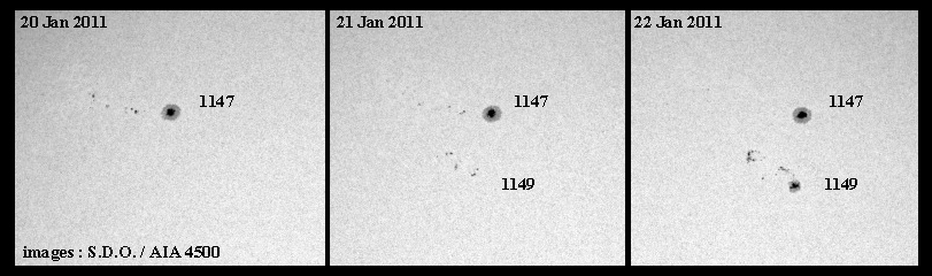
In the Above sequense you can see the evolution of Active Regions 1147 and 1149 at a 3 day period. The interesting part here is that the Eastern component of AR:1147 has started to fade during the appearence of AR:1149.
AR:1147 was a bipolar group with a major Spot and a weak component that finaly dissapeared converting this system to a single polarity Spot, AR:1149 on the other hand is a bipolar group with strong magnetic forces to bound all of the components, this is why AR:1149 has produced such a number of flares from 21 to 22 of January.
B) Chromosphere
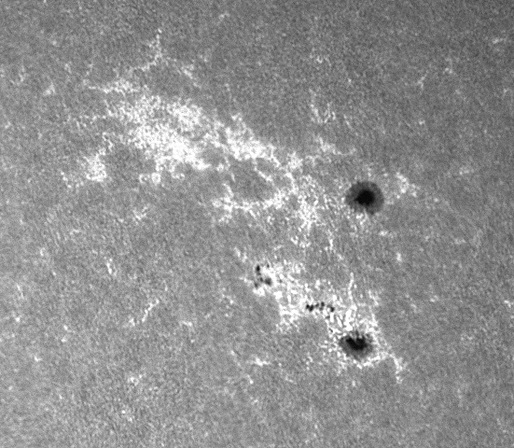
1) Hα' (Active Regions)
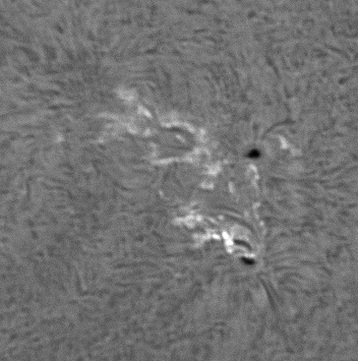
In the left image we see how a complex network of chromospheric formations is conecting the two active regions (1147 & 1149). As we can see, in the case of AR:1147 the second component might have dissapeared from the Photosphere but some bright reminants are still existing in the Chromospheric level. Also we can see that the main spots of both Active Regions are tending to conect with bright material.
The most interesting part of this image is that in the upper left part of the 1147, were the bright material seems to end, there is a formation that seems to be an area with a litle stronger magnetic field than the rest of the Chromosphere.
The most interesting part of this image is that in the upper left part of the 1147, were the bright material seems to end, there is a formation that seems to be an area with a litle stronger magnetic field than the rest of the Chromosphere.
Doppler Study of the area
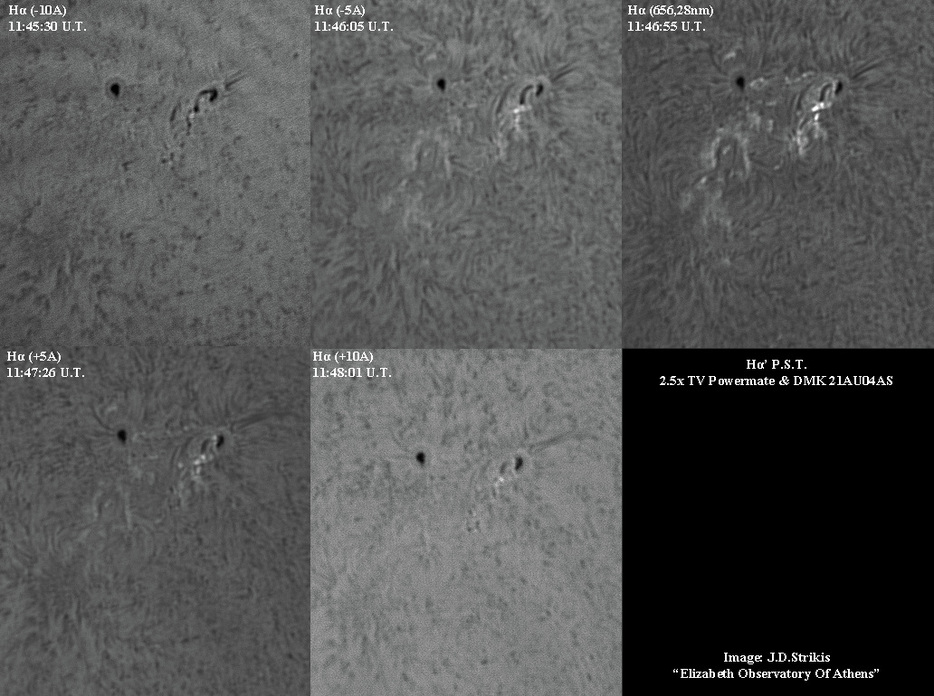
On the Above sequence we can see how the area is changing in the different parts of the Hα' spectrum. This can be really helpfull in order to study how different parts of the area are moving, with the method of substraction and also the RGB combination we tryed to see what was going on on this area.
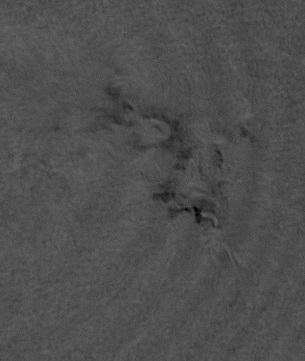
For the left image we substracted the central line image (656.28nm) from the -10A image. So we have the equation
"Image={Left wing (-10A)} - {Ceter of line (6562.8A)}"
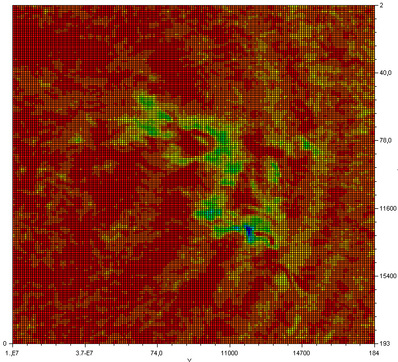
From this equation we get the left image. On the right image we have the intesity diagramm of the left image. On the intensity diagramm we see some circles that are attributed to the "Newton Rings" that are artifacts caused by many parts of the equipement used for the observation.
"Image={Left wing (-10A)} - {Ceter of line (6562.8A)}"
From this equation we get the left image. On the right image we have the intesity diagramm of the left image. On the intensity diagramm we see some circles that are attributed to the "Newton Rings" that are artifacts caused by many parts of the equipement used for the observation.
On this diagramm now we see that most of the image has a dark red colour, this represents the areas of the Solar Chromosphere that does not move on the Sun-Earth axis. The areas that we see in Green colour are those parts of the chromosphere that are moving towards to us. We can also see a small area that has a dark blue colour near the AR:1149, this area is moving towards us in verry hight speed and this is because this is a small "B2
Above are RGB combinations of the different parts of the Hα' line images.
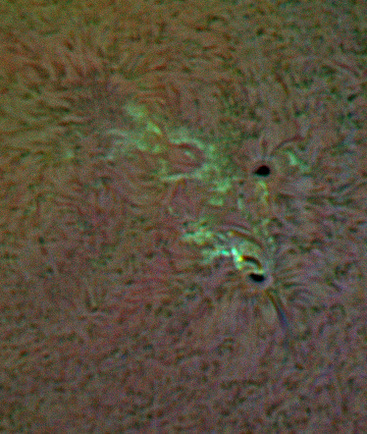
Left : R= (-5A) / G= (6562.8A) / B= (+5A)
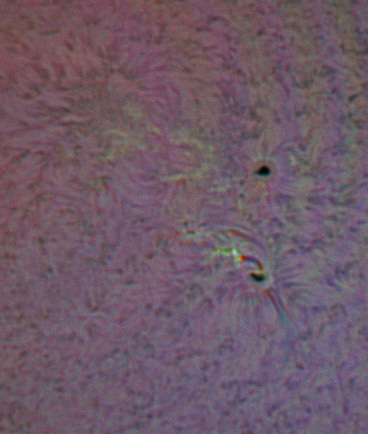
Right : R= (-10A) / G= (6562.8A) / B= (+10A)
Left : R= (-5A) / G= (6562.8A) / B= (+5A)
Right : R= (-10A) / G= (6562.8A) / B= (+10A)
So, for the Left image we say that the Red areas are moving towards us with average speed of +15km/h ~ +25km/h and the Blue areas are moving away from us with average speed of -15km/h ~ -25km/h. For the Green areas now the average speed is -10km/h ~ +10km/h.
B) Chromosphere
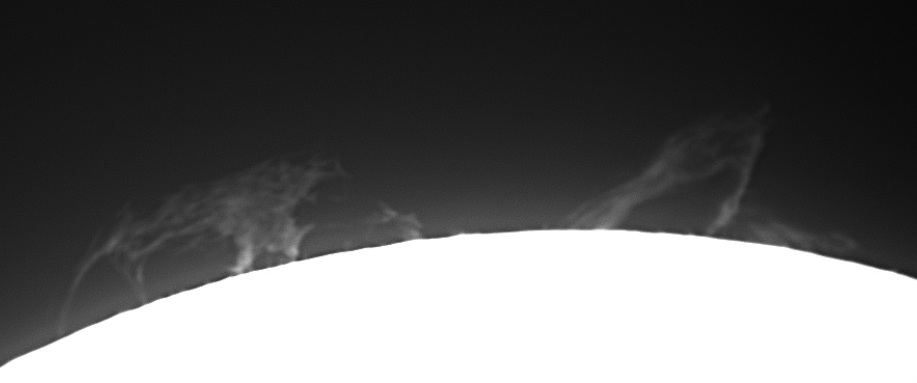
1) Hα' (Prominences)
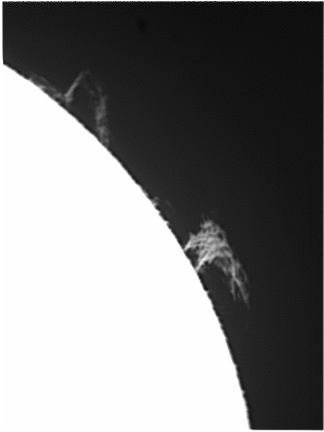
Prominences over the western limb. 22 January 2011 / 11:33:13 U.T.
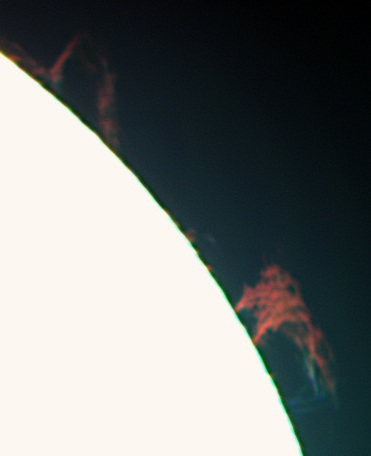
For the better study of the prominence complex seen above we also have to do some Doppler imaging.
So the above images are the results of the two different techniques of the Doppler imaging.
Left image: For this image we have substracted the -10A image from the +10A image. This results that the Dark areas of the image represents the parts of the prominence that are moving toward us and the Lighter areas are those who move away from us.
Right image: For this image we combined in RGB the -10A as Green, the +10A as Blue and the 0A (6562.8A) image as Red.
From this image you can see that the majority of the Prominence complex is static in the Sun - Easrth axis.
B) Chromosphere
2) CaK (Active Regions)
In comparison with the Hα' line image of the same area here we can see how simple things are. The CaK line image at 393.4nm presents us an area of the Solar atmosphere that is between the two major elements of Photosphere and Chromosphere.
Also in this image we can see that like in Hα' image, the AR:1147 still show some activity on the place were the weak component was untill 2 days ago when the smaller spots af this area dissapeared.
Also in this image we can see that like in Hα' image, the AR:1147 still show some activity on the place were the weak component was untill 2 days ago when the smaller spots af this area dissapeared.
B) Chromosphere
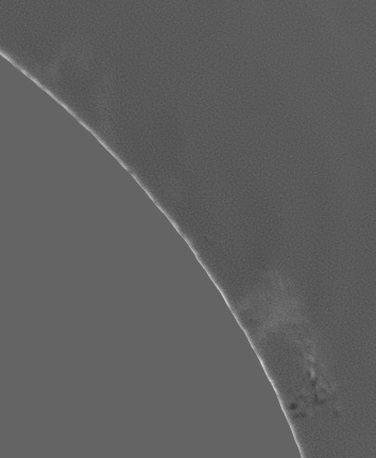
2) CaK (Prominences)
Many small prominences were vissible also in the CaK line filter. But the huge Prominence complex that was vissible in the Hα' line was also present in here. The right part of the complex seemed to be static in the begining of the observing session, after a few images we saw that the upper parts of this prominence started to move away from the Solar surface. After taking more than 30 images of this region and combining them in a single video we saw that this was a huge eruptive prominence.
This is a video resulted from combination of 30 images of the Prominence complex over the North-West limb.
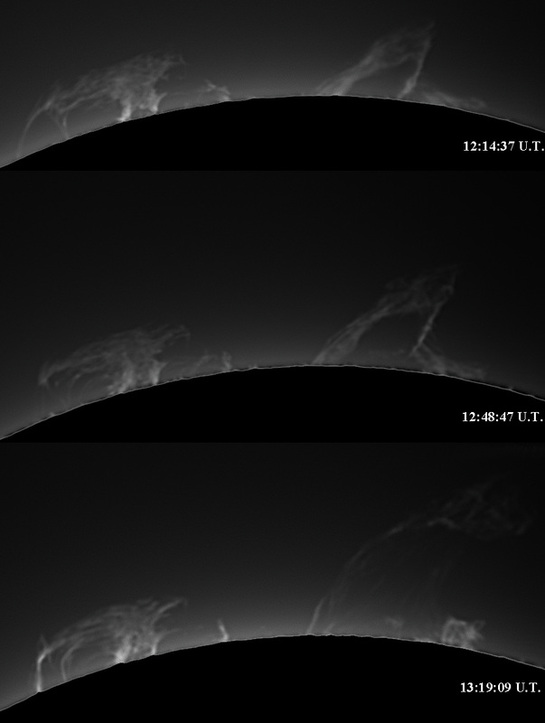
Above you can see the evolution of the erruptive prominence in only one hour. Measuring the time-lapse intervals of one minute we were able to measure an average speed of a litle more than 80.000km/h.
CLEAR SKY
AND
GOOD OBSERVING
CLEAR SKY
AND
GOOD OBSERVING
All the above images are made from the Elizabeth Observatory of Athens by J.D.Strikis. Otherwise mentioned.
